I just spent the majority of this weekend working on a comprehensive financial spreadsheet tracking every single investment transaction I've made in 2015.
(I know, I know, I have NO life.)
I'm using GoogleFinance functions that dynamically update share price and market values, and I am having a blast using pivot tables to break out the data in a variety of ways. Behold the plots I've done so far --
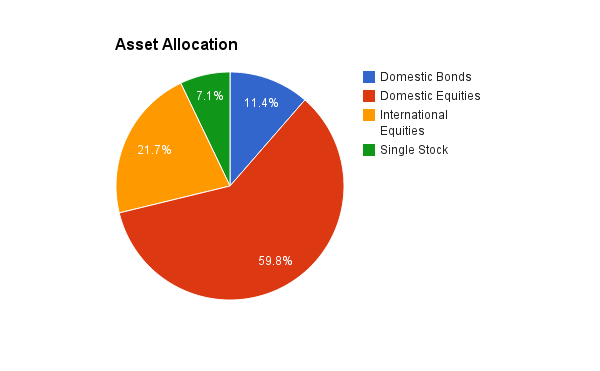
Asset Allocation pie chart (excluding stock options) --
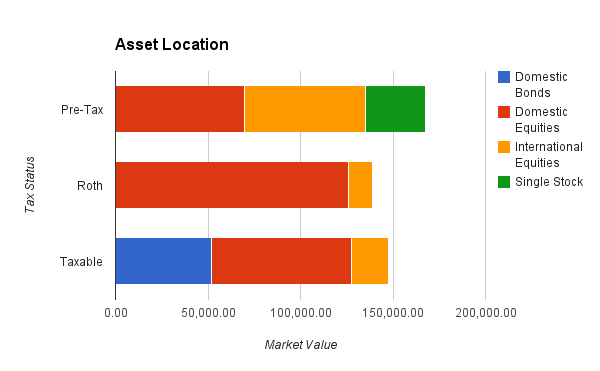
Asset Location bar chart showing asset classes in various tax buckets --
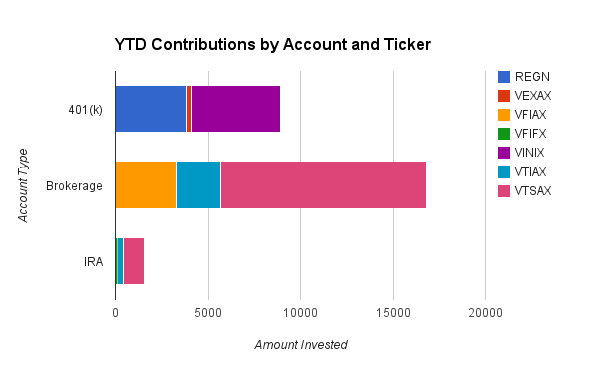
Which accounts and funds my investments have gone --
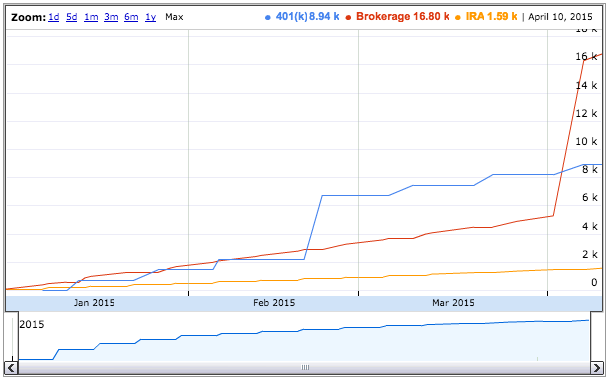
Cumulative timeline of this year's 401(k), IRA, and brokerage contributions --
And now I know that I'm $24,869.60 short on my target allocation for international equities. And I can also recall random Vanguard fund tickers with disturbing familiarity, heh.
Fun with Spreadsheets and Pivot Tables
April 13th, 2015 at 01:33 am
April 13th, 2015 at 02:10 am 1428891006
And get those bonds out of your taxable accounts! Put them in your tax deferred/tax free accounts to avoid paying taxes needlessly.
April 14th, 2015 at 01:26 pm 1429018009
I totally get what you're saying about the location of the bonds, but I'm juggling competing considerations. Namely, I need those bonds (and their interest/dividend payments) to be accessible way before traditional retirement age of 59-1/2 (I'd like to be retired by 35 or 40) -- and that means they've got to be in taxable accounts, which will get drawn down first.
What I might do instead is split the allocation to be proportional within each tax bucket (so 10% for now) to protect them from taxes for the time being, and then up the allocation only in the taxable bucket when I move to 25% bonds in early retirement. That might be a reasonable compromise?